Measuring impact of Quicklink in sites
Implementing Quicklink in sites can speed up navigations, by automatically prefetching in-viewport links during idle time. Different metrics can be improved as a result of this, the most common ones being Start Render and First Contentful Paint.
In this section, we explore different ways of measuring the impact of Quicklink in sites. To showcase that, we’ll use the following sites:
- An unoptimized e-commerce demo, consisting of a listing and a product page. The demo introduces a 1s delay before the product page response, to similate the backend processing time of a real e-commerce site. You can see the code, and make changes by remixing the Glitch project.
- An optimized version of the site, which is a copy of the original version, but this time, using Quicklink in the listing page, to prefetch links that come to the view. You can view and edit the code, in the Glitch project.
If you take a look at the code of the listing page, in the optimized version of the site, you'll find the code to initialize Quicklink:
<script defer src="https://cdn.jsdelivr.net/npm/quicklink@3.0.1/dist/quicklink.umd.js"></script>
<script>
  window.addEventListener('load', () => {
    quicklink.listen();
  });
</script>
Using Chrome DevTools
The first tool you’ll use is Chrome DevTools, which is useful both for local development, and also for production URLs.
First, measure performance before implementing Quicklink:
- Open the unoptimized demo in Chrome.
- Open the Network panel and simulate a Fast 3G Connection.
- Pick Galaxy S5 as simulated device.
- Make sure Disable cache is not checked.
- Reload the page.
- Click on the first product in the listing.
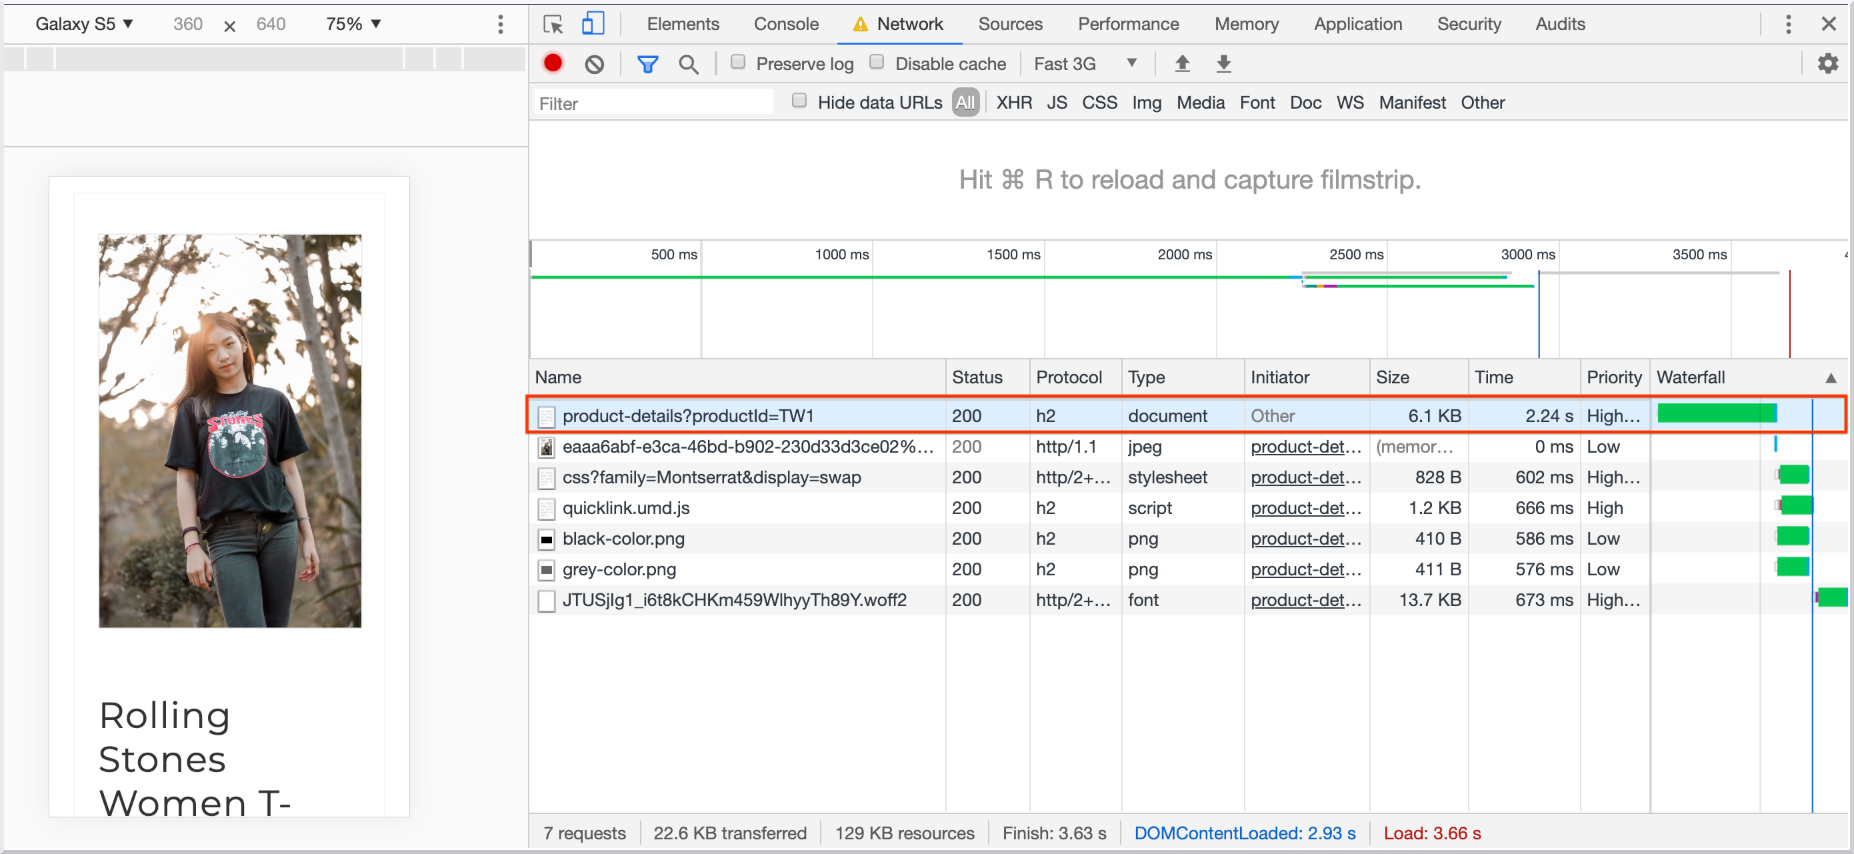
Take a look at the Time column: the product page takes approximately 2.5s to load:
Now, measure performance after implementing Quicklink:
- Open the optimized demo in Chrome.
- Open the Network panel and simulate a Fast 3G Connection.
- Pick Galaxy S5 as simulated device.
- Make sure Disable cache is not checked.
- Reload the page.
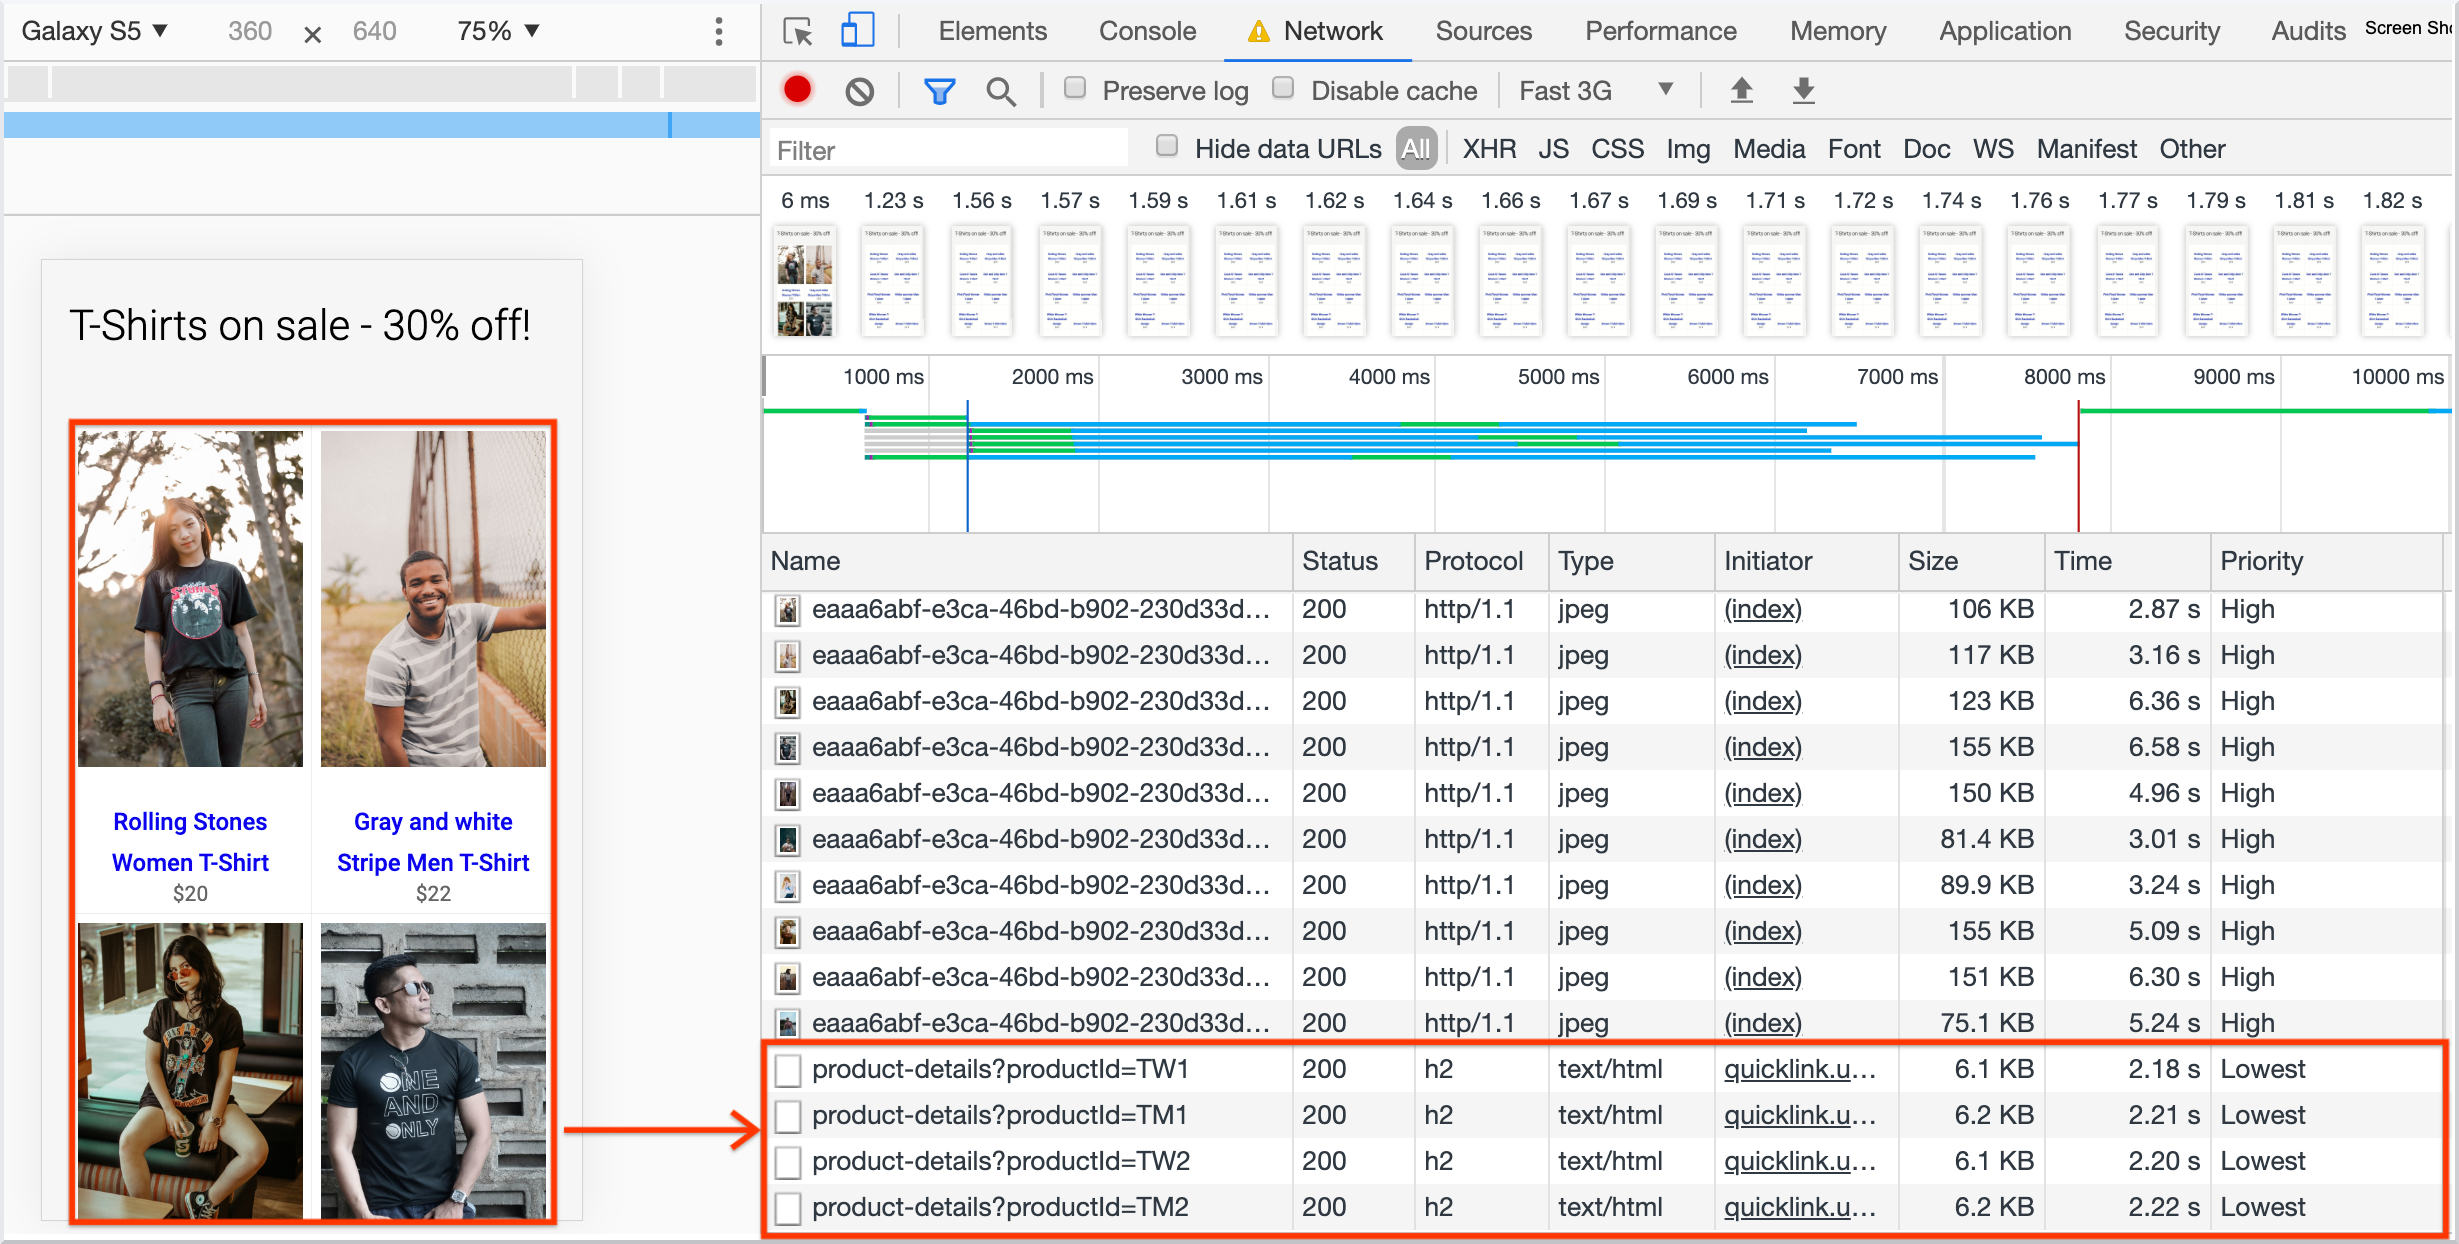
Prefetched links can be identified in the Network panel by having Quicklink as the Initiator and Lowest as the Priority:
To measure the impact of Quicklink on navigations:
- Click on a list item.
- Take a look at the Network panel.
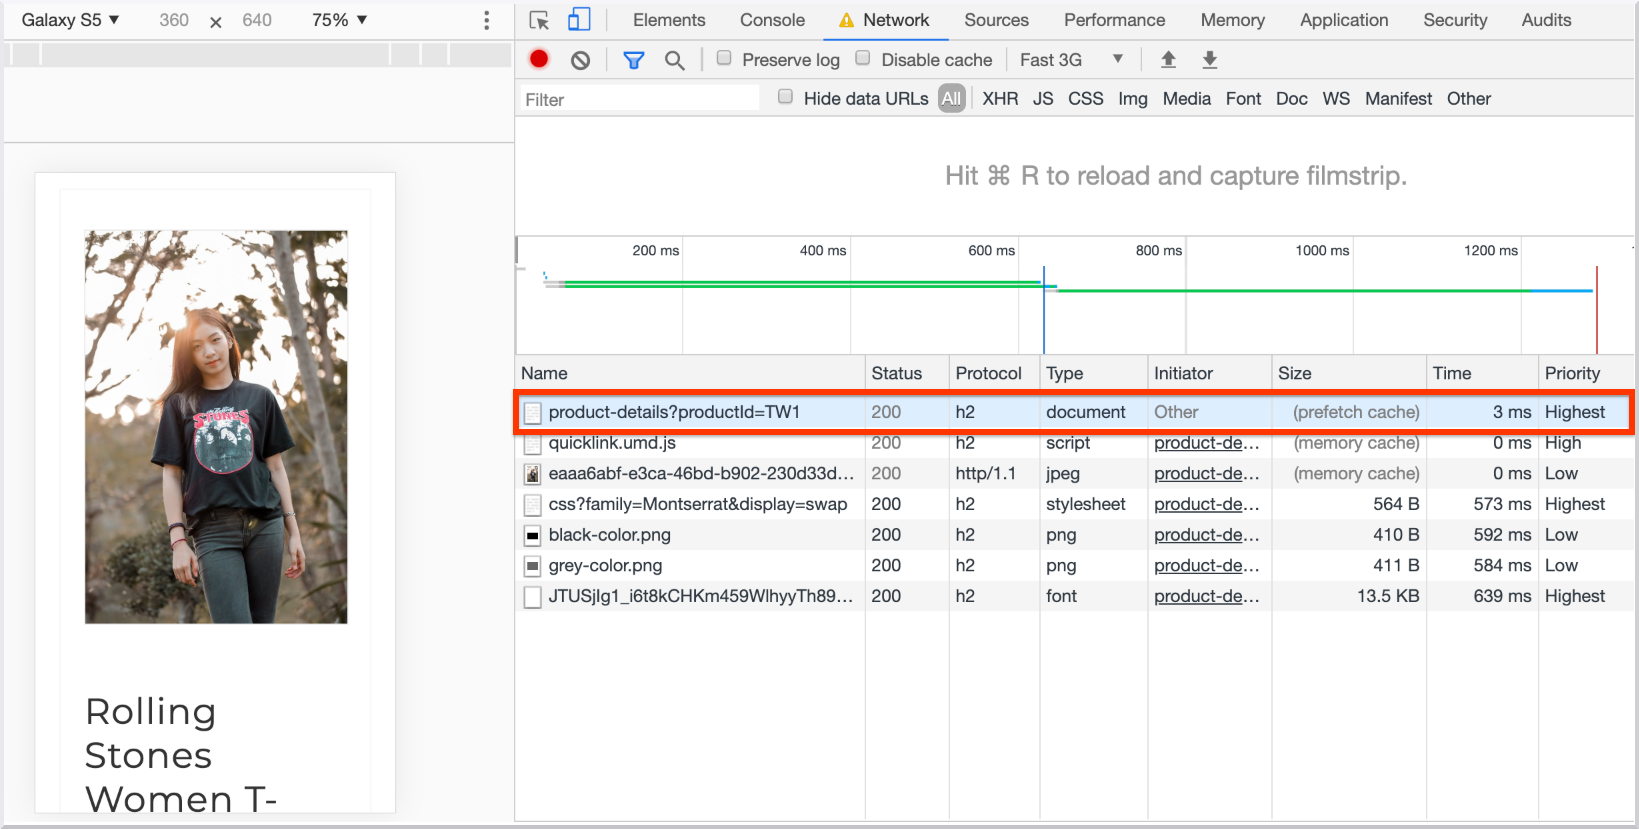
In the Size column of the Network panel the trace shows that the product page was retrieved from the prefetch cache and now takes 3ms to load: a 97% improvement compared to the unoptimized version.
Using Webpagetest
Webpagetest can be used to measure impact on real devices and different connection types. You'll use WPT Scripting to simulate a user arriving at the home page and clicking one of the product items.
Open to webpagetest.org. Pick Nexus 5 as Test Location. In the Advanced Settings tab, pick 3GFast in the connection type. In the Script tab, place the following script:
logData 0
navigate https://mini-ecomm.glitch.me/
logData 1
execAndWait document.querySelector('a').click()
The script instructs WPT to open the unoptimized demo and simulate a click on the first product of the listing. Metrics are captured only for the product page. Here is the resultiing test.
Repeat the process on the demo that uses Quicklink. The script looks like:
logData 0
navigate https://mini-ecomm.glitch.me/
logData 1
execAndWait document.querySelector('a').click()
Here is the resultiing test.
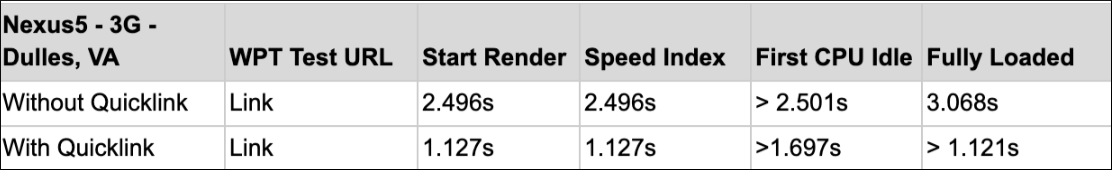
The following table compares the main metrics obtained for each of the sites:
Next, create a comparison between the tests.
- Open the WPT test for the unoptimized site.
- Click on the median run, that appears in the "First View" cell of the report.
- Repeat the same process in the optimized test.
To create a comparison test, you need to append the IDs from the previous links as comma separated valuees, and send them as query params to https://www.webpagetest.org/video/compare.php:
https://www.webpagetest.org/video/compare.php?tests=test_id_1,test_id_2
The resulting comparison of the test ran previously can be found here.
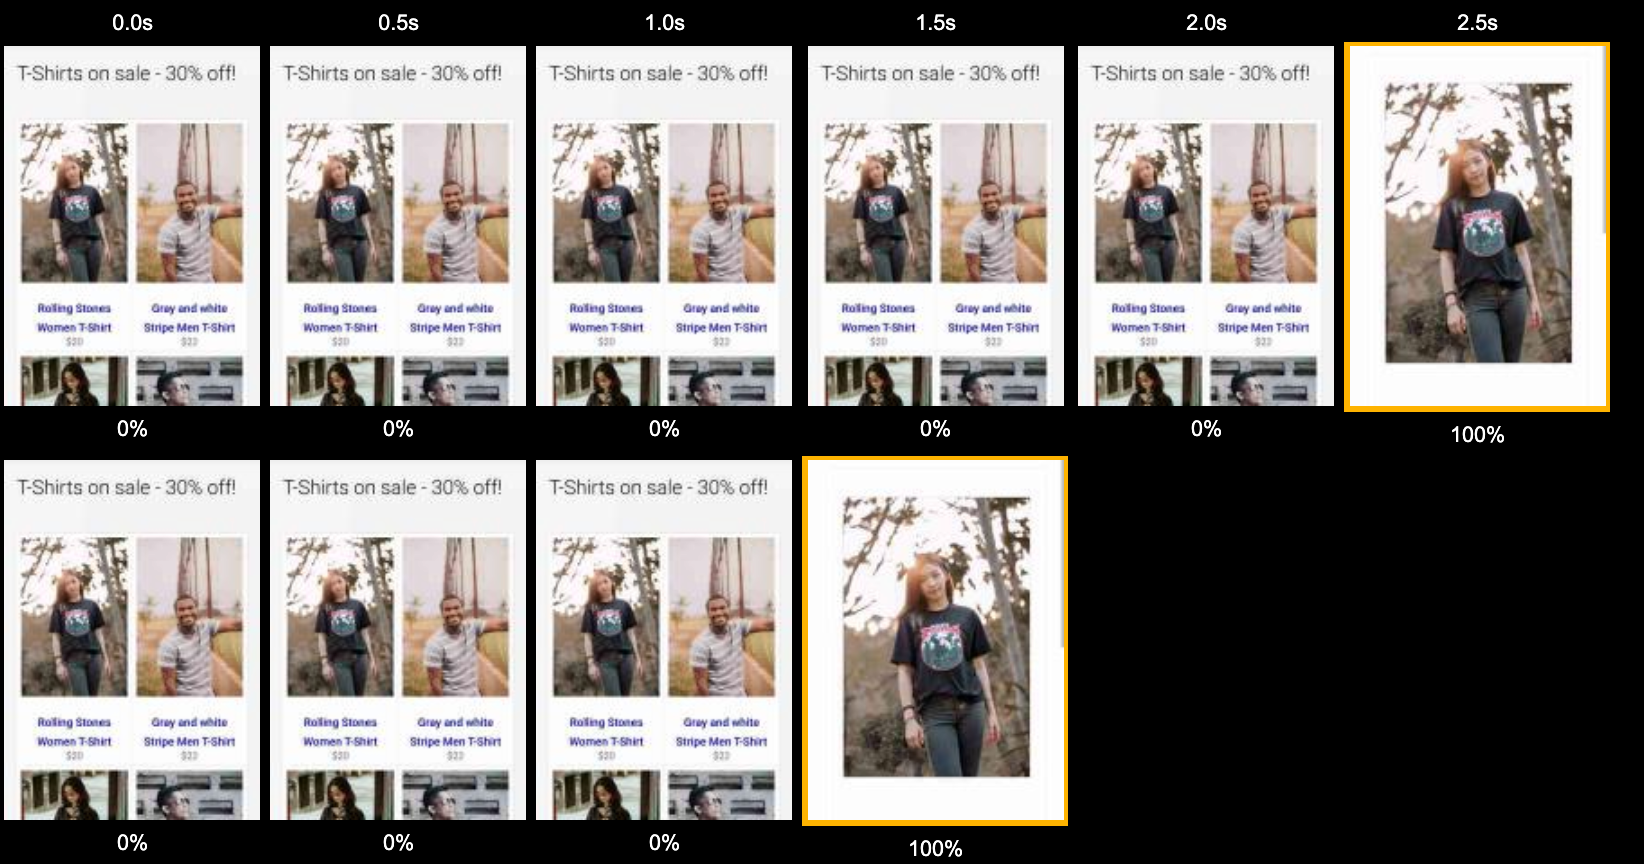
Visual Comparison
The unoptimized site starts rendering approximately at 2.5s, the demo that uses Quicklink, starts at 1.2s.
Video
A video can be generated from the comparison page, by clicking on Create Video.
Using RUM (Real user monitoring) tools
RUM tools, let you visualize how different metrics evolve in time for real users. If prefetching affects a large amount of pages, you might be able to see more page loads being loaded faster after implementing it, which can be reflected in metrics First Contentful Paint.
For example, the Chrome User Experience Report provides performance metrics for how real-world Chrome users experience popular destinations on the web. CrUX data is available in PageSpeed Insights and also in BigQuery, but you can obtain a quick visualization of the evolution of your metrics using the CrUX dashboard (refer to this guide for more details). The report contains a section for First Contentful Paint. If a large number of page views are prefetched as a result of implementing Quicklink, this graph could show a positive evolution in time.
Note: Even when checking the performance for real users is a general performance best practice, it’s usually hard to correlate the overall performance improvement of a site with a single optimization like this one. With that said, the best way to make sure you’re measuring exactly this change is to perform a before / after test with laboratory tools as explained in previous sections.
Using Quicklink Chrome extension
Quicklink Chrome Extension injects Quicklink in every site a user visits. You can use it to measure the potential impact of implementing the library on a site, before doing it. Since the extension will simulate how the library would work when implemented, you can install the extension and then run the tests with DevTools, as described in the previous section.
Conclusion
Quicklink can highly improve navigations by automatically prefetching in-viewport links, . We’ve explored different tools to measure the impact of implementing it in your site. Metrics like Start Render and First Contentful Paint can be directly impacted by this change, but other metrics can be also improved as a result of this, as seen in the tests performed in this guide. Laboratory testing tools, like Chrome DevTools and Webpagetest can help you have an accurate idea of the impact of this change, by running a before / after comparison. Also, If the number of pages affected by this change is large enough, you might be able to visualize the impact of the implementation on real user monitoring (RUM) tools as well.